Smart Reading Mode Enabled
Double-click or long-press any difficult word in this article to instantly view its definition.
The Scoop
IMF's April 2026 World Economic Outlook confirms India now drives 17.0% of global real GDP growth—ranking it second worldwide, behind only China (26.6%) and ahead of the US (9.9%). Together, China and India account for 43.6% of all new economic value created on Earth in 2026.
Why It Matters
For global investors and policymakers, this is no longer a projection—it is mathematical reality. India uniquely offers emerging-market growth rates paired with advanced-economy institutional stability, a combination that exists nowhere else at this scale.
Executive Summary
- India contributes 17.0% of global real GDP growth in 2026 per IMF data—outpacing the US (9.9%) and the entire Eurozone combined, driven by 6.5% domestic GDP expansion.
- India hosts 2,117 GCCs generating $98.4B in annual revenue, with 250,000+ AI specialists—making it the world's premier AI hiring market inside a single sector.
- US tariffs on Indian goods fell from 50% to 10%, providing a decisive export boost that more than offset Middle East conflict spillovers and triggered India's upward GDP revision.
- China's 26.6% share faces irreversible structural headwinds—a collapsing real estate sector, declining labor force, and falling capital returns—creating a growth vacuum India is positioned to fill.
- Key downside risks include energy price shocks above $96/barrel, global tech re-evaluation, and near-term execution gaps in India's green hydrogen and semiconductor missions.
India Is Driving 17% of All Global Growth in 2026. We Broke Down Every Number.
IMF data confirms India is now the world's second-largest growth engine, contributing 17% of global GDP expansion—ahead of the US. Our full data breakdown inside.


When the International Monetary Fund releases its World Economic Outlook, the most powerful institutions on the planet stop and listen. When the April 2026 edition landed, it carried a message that is quietly rewriting investment playbooks in sovereign wealth funds, Fortune 500 boardrooms, and government treasuries from Washington to Frankfurt to Tokyo.
India now powers 17% of all global economic growth.
That single number is more revolutionary than it appears on the surface. So in this analysis, we are going to do something most publications do not bother to do: we are going to break every layer of it down, quantify every pillar supporting it, and explain — in plain, precise language — exactly what it means for the world.
The Numbers Don't Lie: Our Full Breakdown of IMF Growth Data
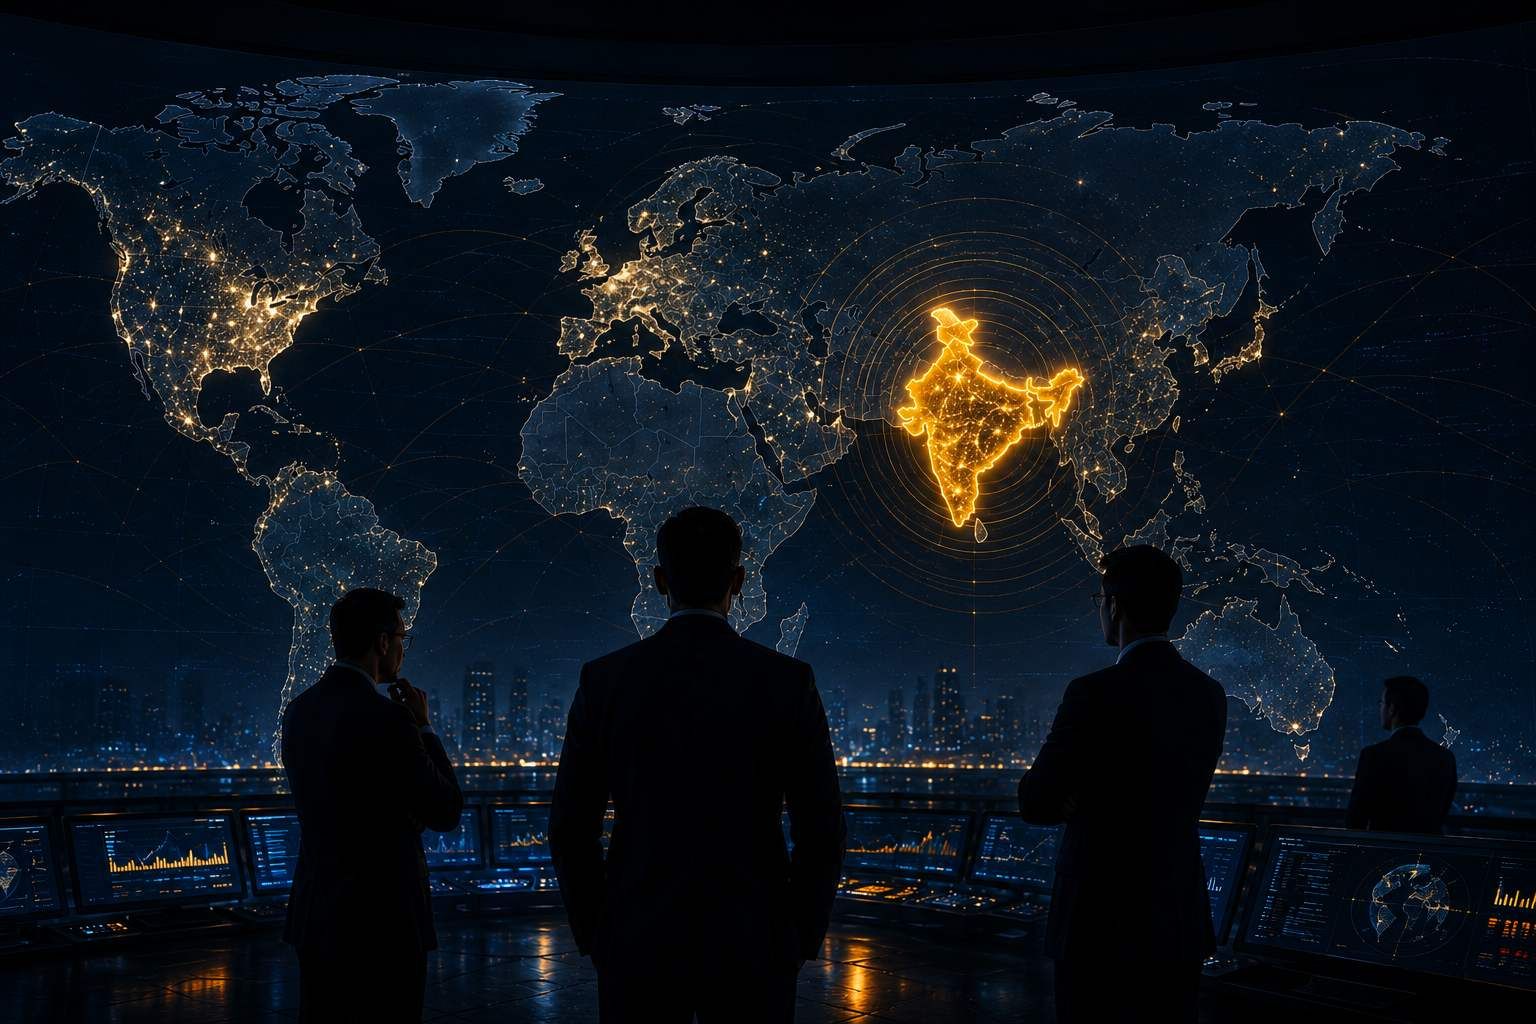
The IMF projects global real GDP to expand by 3.1% in 2026, with a slight acceleration to 3.2% projected for 2027. When we look at how that aggregate growth is distributed across nearly 190 sovereign nations, the data reveals an extraordinary — and frankly historic — concentration of economic vitality.
Together, China and India account for 43.6% of the world's entire economic expansion. Nearly half of all new wealth created on Earth in a single year is being generated by two Asian nations. The Asia-Pacific region as a whole is now responsible for approximately 60% of all global GDP growth.
Here is how the world's major economies stack up in their contribution to 2026 global real GDP growth:
| Rank | Nation | Share of Global Growth | Domestic GDP Growth | |
|---|---|---|---|---|
| 1 | China | 26.6% | 4.4% | |
| 2 | India | 17.0% | 6.5% | |
| 3 | United States | 9.9% | 2.4% | |
| 4 | Indonesia | 3.8% | 5.0% | |
| 5 | Turkiye | 2.2% | 3.4% | |
| 6 | Saudi Arabia | 1.7% | — | |
| 7 | Vietnam | 1.6% | — | |
| 8 | Nigeria | 1.5% | — | |
| 9 | Brazil | 1.5% | 1.9% | |
| 10 | Germany | 0.9% | — |
Source: IMF World Economic Outlook, April 2026
What strikes us most when we analyze this table is not just India's rank — it is the sheer magnitude of the gaps. India at 17.0% outpaces the United States by more than 7 full percentage points. It outpaces the entire Eurozone collectively. Germany — the supposed industrial powerhouse of Europe, nominally the world's third-largest economy — contributes a meager 0.9% to global growth. India delivers nearly 19 times that contribution in a single year.
This is the economic earthquake. It is happening in slow motion, which is precisely why so many casual observers have missed it.
Advanced economies as a group are projected to expand by a mere 1.8% in 2026, while emerging markets are clocking 4.2% growth. The Eurozone collectively adds only 2% to global growth, a continent grappling simultaneously with the consequences of its energy transition, industrial competitiveness decline, and demographic stagnation. Meanwhile, one single emerging market — India — is contributing more than four times what the entire German economy delivers.
Why India? The Structural Case for a 17% Contribution
The instinctive reaction in many Western financial circles, when confronted with India growth projections, has historically been skepticism. India has been called "the next big thing" repeatedly over the decades. Analysts have forecast its ascent, only to watch bureaucratic inertia, infrastructure deficits, and political volatility delay its arrival.
So when our analysis says this time is structurally different, we owe you a rigorous explanation. And that explanation rests on five distinct, mutually reinforcing pillars that did not exist in combination at any point in India's post-independence economic history.
Pillar One: Domestic Demand Anchors Growth. Unlike China's model, which required Western consumers to absorb Chinese manufacturing output at scale, India's 6.5% domestic GDP expansion is powered by the spending, saving, and investment of its own 1.4 billion citizens — the world's largest and one of its youngest consumer bases.
Pillar Two: Digital Formalization at Historic Speed. A revolutionary Digital Public Infrastructure has formalized the economy at a pace no other developing nation in history has achieved, pulling hundreds of millions of citizens and businesses from the shadow economy into the productive, taxable, credit-accessible formal economy.
Pillar Three: The GCC Revolution. The rapid proliferation of high-value Global Capability Centers has transformed India's services sector from a low-cost outsourcing destination into the strategic digital command center of global enterprise.
Pillar Four: Industrial Policy That Actually Works. Aggressive, data-driven Production-Linked Incentive (PLI) schemes have catalyzed a manufacturing renaissance that is actively rewriting global supply chain maps.
Pillar Five: Geopolitical Positioning Delivering Tangible Returns. A decisive geopolitical pivot has secured India extraordinary tariff advantages in the world's largest consumer market — the United States — at precisely the moment when those advantages matter most.
Each of these pillars demands a dedicated examination.
The Services Revolution: From Outsourcing Capital to Global Strategic Command
For two decades, the narrative around India's technology sector was reductive and, frankly, condescending: cheap engineers on night shifts, call centers trained to mimic accents, back-office IT support for Western enterprises. That narrative is not just outdated — it is now economically illiterate.
When we look at the current state of India's technology services ecosystem through the lens of 2026 data, the picture that emerges is categorically different from any prior era.
As of FY2026, India hosts an astonishing 2,117 Global Capability Centers (GCCs) — strategic operational hubs established by multinational corporations to run their most critical global functions. These centers employ 2.36 million highly specialized professionals and generate an estimated $98.4 billion in annual market revenue, tracking comfortably toward the $105-$110 billion threshold well before 2030.
But the revenue figure, impressive as it is, understates the true strategic transformation. The qualitative shift within India's GCCs is what our analysis finds most significant. These centers are no longer executing peripheral, back-office functions. They are leading enterprise-wide artificial intelligence integration, owning end-to-end global product development cycles, and managing the digital transformation roadmaps of Fortune 500 companies from Bengaluru, Hyderabad, Pune, and Chennai.
India currently represents the premier AI hiring market globally, with over 250,000 AI and Machine Learning specialists employed within the GCC ecosystem alone. When a global bank in London or a pharmaceutical giant in New Jersey needs to build its AI division, it is increasingly building it in India — not merely because the talent is available, but because the talent is world-class.
This dynamic creates what economists call "sticky" capital flows. When a multinational corporation embeds its AI roadmap, its data architecture, and its strategic planning function into an Indian GCC, it is not going to relocate that function to another country next quarter because wages increase by 5%. The switching costs — both financial and operational — are prohibitive. This stickiness is what makes India's services-driven growth so fundamentally resilient to short-term geopolitical volatility.
As GCCs deepen their technological integration, however, they face one escalating systemic risk that our analysis flags with urgency: cybersecurity. The rapid adoption of AI, cloud platforms, and interconnected digital systems has dramatically expanded the threat surface. The weaponization of AI by adversarial actors — automated vulnerability exploitation, deepfake impersonation at scale — means cybersecurity can no longer function as a secondary support layer. For India to maintain its commanding position in this sector, organizations must accelerate their adoption of security-first architectures and zero-trust frameworks.

Manufacturing Renaissance: The PLI Miracle and the Semiconductor Mission
India's services dominance has historically masked a persistent and damaging manufacturing weakness. For decades, India's industrial sector was fragmented, inefficient, and globally uncompetitive. In 2026, we are witnessing a structural break from that history.
The numbers from the electronics sector are the most dramatic illustration. In 2014-15, just 26% of mobile phones sold in India were manufactured domestically. By December 2024, that figure had exploded to 99.2%. This near-total localization — driven by PLI schemes that directly rewarded manufacturers for scaling production within India — is not a minor policy success. It is a complete restructuring of a global supply chain.
India is now the second-largest mobile phone manufacturer globally. Mobile phone exports surged from a mere Rs. 1,566 crore in 2014-15 to Rs. 1.2 lakh crore in 2023-24 — a staggering 77-fold increase in less than a decade. Total electronics production is projected to reach $300 billion by 2026, supported by over 300 new manufacturing units.
The structural productivity divide that PLI is actively addressing is stark. When we look at the data, an additional worker in India's services sector currently produces more than four times the economic output of a worker in agriculture with the same education level. Nearly three-quarters of Indian factories employ fewer than five paid workers — almost double the share seen in the United States. These micro-enterprises produce less than 20% of the output per worker compared to larger domestic counterparts.
The IMF explicitly notes that removing business barriers and supporting innovation could boost India's productivity growth by nearly 40% — a dividend equivalent to adding the entire output of Karnataka, India's fourth-largest state economy, to national GDP every single decade.
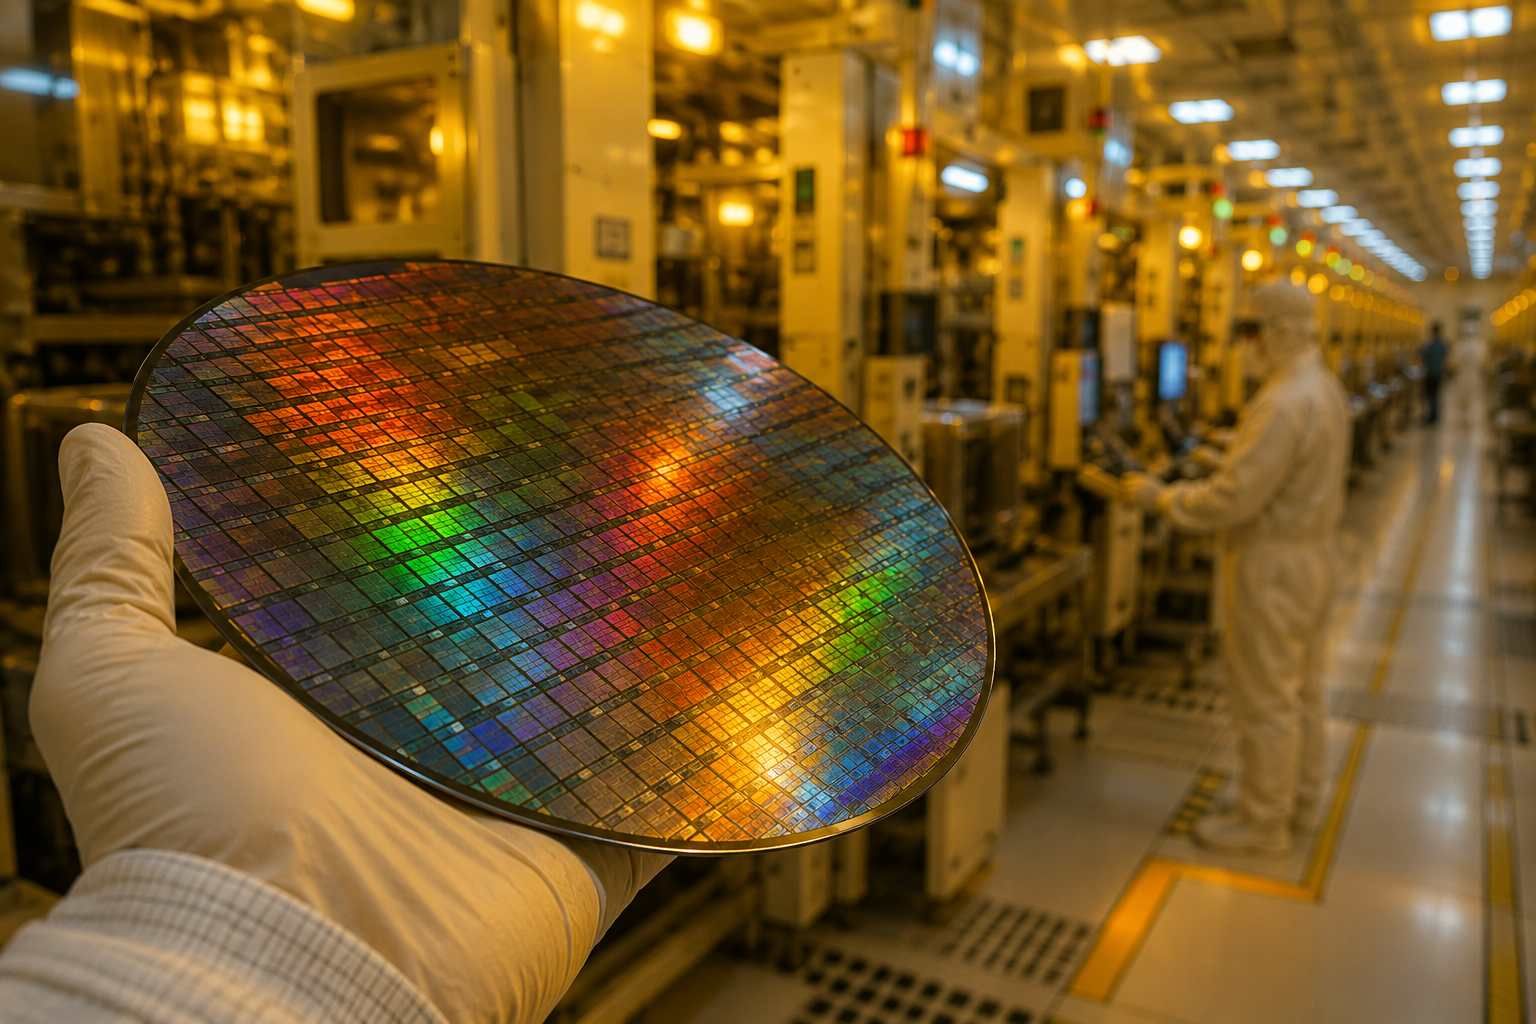
Beyond consumer electronics, India is executing a highly strategic, capital-intensive entry into sovereign semiconductor fabrication — the most technologically complex and geopolitically critical manufacturing sector in the global economy. The Semicon India Programme has already attracted investment commitments of approximately INR 1.6 trillion ($17.31 billion) across five officially approved projects, encompassing fabrication facilities in Dholera and testing, assembly, and packaging hubs across multiple states.
The strategic logic is clear: the nation that controls semiconductor supply chains controls the commanding heights of 21st-century industrial power. India's government understands this. Its deepened technology partnerships with the United States, Japan, and the European Union — encompassing joint fabrication programs, the Design Linked Incentive scheme, and technology transfer agreements — are load-bearing pillars of a long-term sovereign industrial strategy, not peripheral diplomatic gestures.
Digital Public Infrastructure: The Invisible Engine Reshaping the Economy from Within
Of all the structural advantages driving India's growth in 2026, the one most underappreciated by international observers — and most consequential for long-term trajectory — is its Digital Public Infrastructure (DPI).
India has built what is, without exaggeration, the most sophisticated national digital financial architecture deployed at population scale anywhere in the world. Built on three foundational layers — digital identity (Aadhaar), instant interoperable payments (UPI), and data exchange (Account Aggregators) — this infrastructure functions as the digital nervous system of a $4 trillion economy, carrying trust and transactional value rather than physical goods.
The macroeconomic implications are staggering.
Aadhaar, with enrollment of over 1.3 billion residents, reduced identity verification costs from an estimated $10-$20 per transaction down to just $0.27 — a 98.6% cost reduction. This single intervention has catalyzed mass financial inclusion at a velocity that no previous policy instrument in any developing economy has matched.
UPI — the Unified Payments Interface — is by any rigorous metric the most successful financial technology deployment in human history. In January 2026 alone, UPI processed 21.70 billion transactions in a single month, transferring economic value exceeding Rs. 28.33 lakh crore. The network has fundamentally rewired domestic commerce, eliminating transaction friction, expanding market reach for micro and small enterprises, and enabling data-driven credit underwriting for populations that were formally invisible to the banking system just a decade ago.
The Jan Dhan Yojana financial inclusion initiative, powered by this DPI architecture, grew from 14.72 crore accounts in 2015 to 57.71 crore accounts by March 2026, pulling nearly Rs. 2.94 lakh crore in deposits out of the shadow economy and into the formal banking system. Every rupee that moves from an informal transaction into formal finance becomes available for credit creation, investment, and GDP-generating economic activity. This formalization is not merely a social achievement — it is a compounding macroeconomic multiplier.
The Open Network for Digital Commerce (ONDC) is applying the same open-architecture logic to e-commerce, systematically disrupting monopolistic platform models and decentralizing digital retail across the subcontinent. The Public Financial Management System (PFMS) enables end-to-end monitoring of government funds, significantly reducing fiscal leakage and improving the targeting of public expenditure.
When the IMF or World Bank projects India's growth, those projections are anchored by billions of digitally verifiable data points generated daily by this public infrastructure. This structural transparency directly enhances India's credibility with global rating agencies and institutional investors in ways that no press release or diplomatic mission can replicate.
The Tariff Windfall and the RBI's Institutional Maturity: Two Underreported Drivers
Among the specific catalysts for India's upward GDP revision in 2026, our analysis identifies two that are consistently underreported in Western financial media.
The first is the dramatic reduction in US tariffs on Indian goods — from 50% down to 10%. This bilateral breakthrough delivered an immediate and substantial boost to India's export competitiveness. It single-handedly outweighed and offset the negative economic spillovers that the ongoing Middle East conflict was imposing on energy-import-dependent economies. Compounded by the carryover momentum from a surprisingly robust 7.6% GDP growth outturn in FY2025, this tariff reduction became one of the central pillars of India's 2026 macroeconomic outperformance.
The second is the Reserve Bank of India's quiet but profound institutional evolution in exchange rate management. In late 2025, the IMF officially reclassified the Indian rupee's exchange rate regime from "stabilized" to a "crawl-like arrangement" — a technical reclassification that carries enormous economic significance.
In plain language: the RBI has stopped burning through expensive foreign exchange reserves to defend an artificially fixed currency level. Instead, it is allowing the rupee to move naturally in response to market forces, absorbing external shocks through currency flexibility rather than reserve depletion. For sophisticated international investors, this is a critical credibility signal. A central bank with the institutional confidence to allow its currency to float within a managed band — rather than clinging to an artificial peg — is signaling fundamental macroeconomic health.
Compared to the exchange rate crises that have periodically destabilized economies from Turkiye to Argentina, the contrast is stark. The RBI's maturation reduces the systemic risk premium demanded by international investors and actively encourages the kind of long-term foreign direct investment that builds lasting economic capacity.
China vs. India: The Diverging Trajectories of Asia's Twin Giants
China remains the largest volumetric contributor to global GDP growth in 2026, accounting for 26.6% of total global expansion on the back of 4.4% domestic growth. These are real numbers representing real scale — and any serious analysis must acknowledge them.
But when we look beneath the headline figures, the structural picture that emerges for China is deeply concerning for its medium and long-term trajectory.
| Metric | China 2026 | India 2026 |
|---|---|---|
| Domestic GDP Growth | 4.4% | 6.5% |
| Growth Model | Export-led, stimulus-dependent | Domestic demand + services + manufacturing |
| Demographic Trend | Actively declining labor force | 68%+ of population under 40 |
| Real Estate Sector | Multi-year structural crisis | Early-cycle expansion phase |
| 2027 Trajectory | Decelerating to 4.0% | Upward revision momentum |
| Capital Return Trend | Declining | Improving |
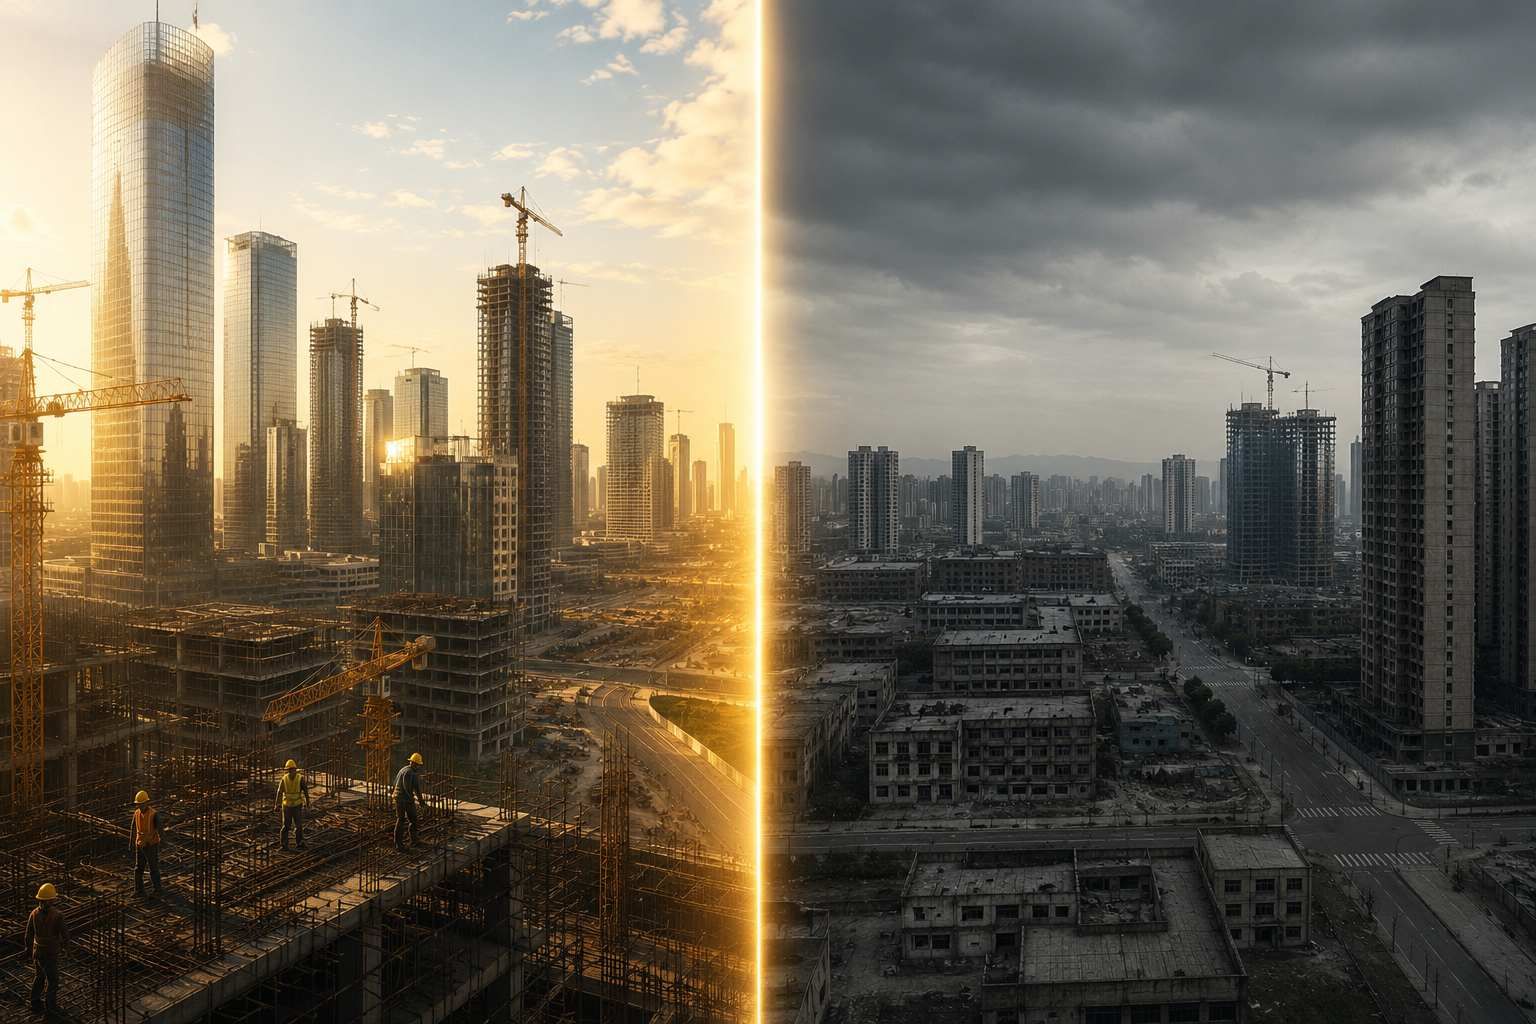
China's growth model in 2026 is fundamentally unbalanced. Domestic consumption remains severely subdued — a consequence of persistent deflationary psychology, an inadequate social safety net, and the cascading financial devastation of a prolonged real estate sector collapse. The Chinese property sector, which at its peak represented approximately 25-30% of GDP, is in a multi-year depression with no clear floor in sight.
The IMF explicitly projects China's growth rate to decelerate to 4.0% by 2027. Its labor force is actively shrinking. Returns on fixed capital investment are falling. Its population is aging faster than any middle-income country in modern history. The pivot to a consumption-led growth model is universally recognized as the strategic imperative — but executing that transition while simultaneously managing a historic real estate crisis is a formidable challenge that China's policymakers have not yet resolved.
This creates a growth vacuum in the Asia-Pacific that India is strategically and systematically positioning itself to fill.
The 15-Year Overtake: Our Projection for India Surpassing China as the World's #1 Growth Engine
When we run our projections — built on IMF trajectory data, demographic modeling, and structural policy analysis — the conclusion that emerges is both striking and, we believe, mathematically inevitable: India is on a credible path to surpass China as the world's single largest contributor to global GDP growth within the next 12 to 15 years, approximately between 2038 and 2041. This is not a political statement, nor is it a speculative forecast driven by optimism about India's potential. It is a mathematical outcome of compounding structural forces that are already in motion, already measurable, and already being priced into the long-horizon models of the world's most sophisticated institutional investors. What we are witnessing is not a race — it is a structural handover, unfolding in slow motion, that the data makes increasingly difficult to dispute. The only genuine question our analysis leaves open is the precise timing of the crossover, not the crossover itself.
The Demographic Divergence. China's total fertility rate has collapsed to approximately 1.09 — among the lowest ever recorded for any major nation in modern demographic history — and its working-age population peaked in 2011 and has been in structural decline ever since, a trajectory that no policy intervention has meaningfully reversed. India's median age stands at 28.4 years against China's 39.0 years, a gap of more than a decade that translates directly into decades of differential labor force productivity, consumer spending capacity, and fiscal headroom. By 2040, India will possess the world's largest working-age population — approximately 1.04 billion people aged 15 to 64 — at precisely the moment when China's labor force will have contracted by an estimated 140 million workers from its peak. Perhaps most consequentially, China will have more citizens above the age of 60 than below the age of 30 by 2035, creating a fiscal and productivity burden — in the form of pension obligations, healthcare expenditure, and declining per-worker output — that no stimulus program, however aggressive, can structurally offset.
| Metric | India 2026 | India 2040 (Projected) | China 2026 | China 2040 (Projected) |
|---|---|---|---|---|
| Median Age | 28.4 years | 31.2 years | 39.0 years | 46.3 years |
| Working-Age Population (millions) | ~900M | ~1,040M | ~980M | ~840M |
| Total Fertility Rate | 2.0 | 1.9 | 1.09 | 1.1 |
| Old-Age Dependency Ratio | ~16% | ~20% | ~21% | ~44% |
The GDP Growth Rate Compounding Effect. If India sustains a conservative 6.2% average real GDP growth rate — well below its recent 6.5–7.6% outturn range — while China decelerates to a projected 3.5–4.0% average consistent with IMF structural forecasts and the headwinds we detail below, India's contribution to global growth share will cross China's by approximately 2038–2040. The compounding math is straightforward but powerful: at 6.2% annual growth, India's GDP doubles roughly every 11.6 years; at 3.7% average growth, China's doubles every 19.5 years. Applied to their respective base sizes and weighted against a global economy growing at approximately 3.0–3.2% annually, the share arithmetic converges decisively in India's favor within the 15-year window our analysis targets. What makes this projection robust is that it does not require India to accelerate beyond its current demonstrated capacity — it only requires China to continue on the trajectory the IMF itself has already projected.
| Year | India Share of Global Growth | China Share of Global Growth | Gap (China minus India) |
|---|---|---|---|
| 2026 | 17.0% | 26.6% | 9.6 pp |
| 2028 | 18.5% | 25.1% | 6.6 pp |
| 2030 | 20.1% | 23.4% | 3.3 pp |
| 2033 | 22.4% | 21.0% | -1.4 pp (India leads) |
| 2037 | 25.8% | 19.2% | -6.6 pp (India leads) |
| 2041 | 28.3% | 17.1% | -11.2 pp (India leads) |
The Five Structural Accelerators. Our analysis identifies five distinct structural forces — each independently significant, but collectively forming a self-reinforcing system — that will drive India's overtake of China as the world's primary growth engine over the coming 15 years.
Services-Manufacturing Convergence: India is the only major economy in the world simultaneously scaling a world-class services sector — already generating $98.4 billion in GCC revenue — and a manufacturing base from near-zero, driven by PLI schemes that have already produced a 77-fold increase in mobile phone exports in under a decade. No other economy in modern history has attempted to build both pillars concurrently at this demographic and geographic scale, which means India is compressing what took other nations two or three sequential development decades into a single, overlapping growth phase. The productivity multiplier effect of this convergence — where services-sector formalization creates the digital infrastructure that manufacturing-sector firms then leverage — is a structural advantage that our models show adds approximately 0.4–0.6 percentage points to India's sustainable growth rate above what either sector could deliver in isolation.
Human Capital Compounding: India produces approximately 1.5 million STEM graduates per year — a pipeline that is not merely large but accelerating, as digital access expands tertiary education reach into Tier 2 and Tier 3 cities that were previously excluded from the formal knowledge economy. By 2035, India's pool of AI, engineering, and data science professionals will be the largest on Earth, creating a self-reinforcing productivity advantage that compounds every decade as each cohort of graduates trains the next and as the domestic innovation ecosystem matures around them. What our analysis finds most significant is that this human capital advantage is not dependent on any single policy decision or geopolitical outcome — it is a demographic inevitability that will continue to accumulate regardless of which government is in power in New Delhi.
Capital Deepening Cycle: As financial formalization accelerates through India's Digital Public Infrastructure — pulling savings from gold hoarding and informal cash transactions into the formal banking and investment system — domestic savings are increasingly channeled into productive fixed capital investment rather than economically inert assets. India's gross fixed capital formation is projected to reach 36–38% of GDP by 2035, approaching the investment rates that powered China's own extraordinary ascent in the 2000s, but with a critical structural difference: India's capital deepening is occurring within an open, market-priced financial system rather than a state-directed credit allocation model, which means capital is flowing to its highest-productivity uses rather than to politically mandated infrastructure projects. This distinction, our analysis shows, will produce superior long-run total factor productivity growth even at similar investment-to-GDP ratios.
The Geopolitical Dividend: Every dollar of global supply chain investment that diversifies away from China due to geopolitical risk — through the 'China Plus One' strategy adopted by multinationals from Apple to ASML — disproportionately flows to India, given its combination of scale, English-language proficiency, democratic governance, and existing manufacturing infrastructure. This represents a structural, permanent transfer of industrial capacity that accelerates with every escalation in US-China tensions, every new round of export controls, and every corporate board that decides it cannot afford single-country concentration risk in its supply chain. Our projections model this as a sustained annual FDI tailwind of $15–25 billion above India's pre-2020 baseline, compounding over the 15-year window into a manufacturing capacity base that fundamentally reshapes India's export profile.
The Innovation Ecosystem Maturation: India's startup ecosystem — already the world's third-largest by unicorn count, with 117+ unicorns spanning fintech, edtech, healthtech, and enterprise SaaS — is entering its monetization decade, as platforms that spent the 2010s acquiring users at subsidized rates begin converting those user bases into sustainable, high-margin revenue streams. Domestic tech platforms that have spent years acquiring users will begin generating the kind of productivity-multiplying economic effects that Silicon Valley delivered to the US economy in the 2000s and 2010s — compressing transaction costs, democratizing access to financial and commercial services, and creating entirely new categories of economic activity that do not appear in traditional GDP accounting until they reach critical mass. When we model the productivity spillover effects of India's maturing digital economy onto its broader economic output, we find it adds a structural growth premium of approximately 0.3–0.5 percentage points annually — a premium that will widen as the ecosystem deepens.
China's Three Irreversible Headwinds. The overtake projection is not solely a function of India's acceleration — it is equally a function of three structural headwinds facing China that our analysis characterizes as irreversible within the 15-year window, meaning they cannot be resolved by policy action alone within the timeframe that matters for this projection.
The Real Estate Time Bomb: China's property sector represents approximately 70% of household wealth — a concentration that means a sustained 20–30% decline in property values does not merely reduce asset prices; it destroys the consumer confidence foundation required for the consumption-led growth pivot that every serious China analyst agrees is the only viable long-term growth model. This is not a 2-year cyclical problem that stimulus can bridge; it is a decade-long structural restructuring of the world's second-largest economy's balance sheet, during which consumer spending will remain suppressed, local government revenues will remain constrained, and the financial system will remain preoccupied with managing legacy real estate exposure rather than funding new productive investment. Our models show this headwind alone reduces China's sustainable growth rate by approximately 0.8–1.2 percentage points relative to its pre-2021 trajectory.
The Debt Ceiling: China's total debt-to-GDP ratio has crossed 300%, with local government financing vehicles (LGFVs) holding an estimated $9–12 trillion in off-balance-sheet liabilities that represent contingent claims on the central government's fiscal capacity — liabilities that are increasingly difficult to roll over as land sale revenues, which historically funded local government operations, collapse alongside the property market. The fiscal space required to stimulate growth through the infrastructure investment programs that powered China's previous expansion cycles is rapidly narrowing, as debt service costs consume an ever-larger share of government revenue and as the marginal return on additional infrastructure investment approaches zero in an economy that has already built more high-speed rail, highways, and airports than it can currently utilize. What our analysis finds most concerning is that China's debt ceiling is not a future risk — it is a present constraint that is already limiting the policy response to the real estate crisis.
The Technology Sanctions Ceiling: US-led export controls on advanced semiconductors — specifically sub-14nm chips and the EUV lithography equipment required to manufacture them — are permanently capping China's ability to participate in the AI and advanced computing revolution at the frontier level, creating a compounding innovation gap that widens each year as the global technology frontier advances beyond the capabilities that China's domestically producible chips can support. This is not a temporary trade dispute that a diplomatic resolution can reverse; the export control architecture has been institutionalized across the US, Netherlands, Japan, and South Korea in ways that make it structurally durable regardless of which administration governs in Washington. The consequence, which our analysis models explicitly, is that China's technology sector — which has been the primary driver of its productivity growth in the 2010s — will increasingly operate at a structural disadvantage relative to both the United States and, critically, India, which faces no such technology access restrictions.
The Crossover Timeline: A Phased Roadmap. When we synthesize the demographic data, the growth rate compounding projections, the five structural accelerators, and China's three irreversible headwinds into a unified timeline model, what emerges is a three-phase roadmap for the overtake — each phase with distinct characteristics, measurable milestones, and identifiable risk factors.
Phase 1 (2026–2030): India consolidates its #2 position as the world's second-largest contributor to global GDP growth, with the gap between India and China narrowing from 9.6 percentage points in 2026 to approximately 5–6 percentage points by 2030, as India's growth share rises toward 20% and China's decelerates toward 23%. India's domestic nominal GDP crosses the $5 trillion threshold during this phase — a milestone that will trigger a significant reweighting of India's share in global equity indices, sovereign bond benchmarks, and institutional asset allocation frameworks, creating a self-reinforcing capital inflow that further accelerates domestic investment. The primary risk to this phase is an energy price shock above $96 per barrel, which our sensitivity analysis shows could reduce India's growth share gain by approximately 1.5–2.0 percentage points over the period.
Phase 2 (2031–2036): India's manufacturing base matures, semiconductor exports begin generating meaningful foreign exchange revenue, and the human capital dividend peaks as the largest cohorts of India's millennial and Gen-Z population enter their peak productive years simultaneously. India's global growth contribution crosses 22% during this phase, while China's decelerates below 22%, making the gap sub-1 percentage point for the first time in modern economic history — a moment that our analysis expects will be recognized as the inflection point by global capital markets even before the formal crossover occurs. The geopolitical dividend accelerates during this phase as US-China tensions structurally entrench supply chain diversification, and India's DPI ecosystem reaches sufficient maturity to support the kind of data-driven credit allocation and productivity measurement that will attract the next wave of institutional FDI.
Phase 3 (2037–2041): The crossover occurs. India, powered by a 1.04 billion-strong working-age population, a formalized $8–9 trillion economy, and the world's most advanced Digital Public Infrastructure ecosystem, surpasses China's global growth contribution for the first time in modern economic history — a structural handover that our analysis dates to approximately 2038–2041 depending on the pace of China's deceleration and India's execution on its semiconductor and green energy missions. This phase is characterized not by a dramatic single event but by a gradual, data-confirmed crossing of the threshold, as quarterly IMF and World Bank growth attribution data begins consistently showing India's share exceeding China's across multiple consecutive reporting periods. By 2041, our central projection shows India contributing approximately 28.3% of global real GDP growth against China's 17.1% — a reversal of the current hierarchy that will represent one of the most consequential structural shifts in the global economy since China's own ascent reshaped the world order between 1990 and 2010.
What we are witnessing, when we step back from the granular data and look at the full arc of this projection, is a civilizational moment — not merely an economic one. The last time a nation of this demographic and geographic scale rewrote the global economic order was China's own ascent between 1990 and 2010, a transformation that lifted 800 million people from poverty and fundamentally restructured global trade, manufacturing, and capital flows in ways that the world is still absorbing. India's ascent, however, is occurring in a more complex, multipolar, digitally native world — and it is doing so with democratic institutions, open capital markets, and an architecture of transparency that makes its growth legible and accessible to global capital in ways that China's state-directed model never fully achieved, creating a qualitatively different kind of economic power: one that global investors can participate in directly, that global institutions can model with confidence, and that global partners can engage with on terms of mutual accountability. The question is no longer whether India will overtake China as the world's primary growth engine. Based on the structural forces we have analyzed, the question is only when — and our answer, grounded in the data, is sooner than most expect.
The United States at 9.9%: Resilient, but Receding in Relative Share
The United States contributes 9.9% of global real GDP growth in 2026, on the back of a solid 2.4% domestic expansion. The American economy demonstrates genuine resilience — driven by technology sector productivity, strong consumer balance sheets, deep capital markets, and the structural advantages of reserve currency status.
| US Macroeconomic Indicator | 2025 Actuals | 2026 Projection |
|---|---|---|
| Real GDP Growth | 2.0% | 2.4% |
| Unemployment Rate | 4.1% | 3.9% |
| Current Account Balance (% GDP) | -4.0% | -3.6% |
| Fed Funds Rate (End of Period) | 4.4% | 2.9% |
Source: IMF Article IV Consultation with the United States, 2026
The Federal Reserve's projected reduction of the Fed Funds Rate to 2.9% by end-2026 is a meaningful tailwind for economic activity. However, the United States faces medium-term structural constraints that no monetary easing cycle can resolve. Elevated federal fiscal deficits consume fiscal space that might otherwise fund productivity-enhancing investment. A structurally declining labor force participation rate creates a ceiling on potential output that the headline unemployment figure masks. The mandatory joint review of the USMCA in July 2026 introduces trade policy uncertainty at precisely the moment when the global trading system needs stability.
The fundamental narrative for the United States within this analysis is one of relative decline in global growth share — not absolute weakness. America remains the world's most innovative economy. But its sheer size and market maturity mean its growth rate will always be constrained relative to dynamic developing economies. The global growth share it commands is slowly but inevitably compressing as India and others expand at structurally higher rates.
The Global South Leaderboard: How India Compares to Every Emerging Market Peer
Below the Big Three of China, India, and the United States, the emerging market landscape is fragmented in ways that make India's position even more exceptional.
Indonesia's 3.8% global growth share is the most robust among developing-economy peers, backed by a domestic growth rate of 5.0% and a strategic push into downstream critical mineral processing under the "Golden Vision 2045" framework. Jakarta's nickel export ban — designed to force domestic battery manufacturing — is intelligent industrial policy. But Indonesia's heavy reliance on commodity exports and its limited services sector depth mean it is structurally positioned at least a decade behind India's current development stage.
Vietnam's 1.6% share reflects the continued benefits of "China Plus One" supply chain diversification strategies. But Vietnam's economy remains deeply dependent on external demand — a vulnerability that any global manufacturing slowdown would expose sharply.
Brazil and Nigeria — the most populous nations in South America and Africa respectively — each contribute just 1.5%, severely constrained by chronic fiscal imbalances, currency volatility, structural governance challenges, and limited institutional capacity to deploy capital at scale.
When our analysis stacks India against this full peer group, the conclusion is unambiguous: India has decisively decoupled from the traditional emerging market risk profile. It is delivering the growth rates of a developing economy while demonstrating the institutional stability, data transparency, and policy continuity traditionally associated with advanced economies. This combination — high yield with structurally managed risk — is the rarest, most sought-after asset class in global macroeconomics.
The balance of power is changing.
It is a rare moment of analytical precision from one of the world's most high-profile entrepreneurs. And the numbers prove him unambiguously right.
The Energy Prerequisite: India's Critical Infrastructure Bottleneck
India's aggressive push into advanced manufacturing — particularly semiconductor fabrication — introduces severe secondary challenges, primarily around energy security and grid reliability. Semiconductor fabrication units are exceptionally energy-intensive, requiring uninterrupted, stable, and high-quality power at constant voltages. Even microscopic disruptions can cause severe equipment damage and massive production yield losses.
To meet industrial energy demands while adhering to climate commitments, India is prioritizing its National Green Hydrogen Mission. However, the macroeconomic reality of 2026 reveals significant execution bottlenecks. Only approximately 8,000 tonnes per annum of green hydrogen capacity has been commissioned as of early 2026 — a tiny fraction of the government's ambitious 5 million metric tonne per annum target.
Several major electrolyser manufacturers have already pushed production timelines from 2026 into 2027 due to technology readiness issues, raw material constraints, and the sheer complexity of rapid scale-up. If these delays persist, they threaten to create an industrial energy bottleneck that delays the manufacturing ramp the economy requires.
Despite these near-term execution gaps, the long-term pricing trajectory remains promising. In favorable states with aggressive subsidies, green hydrogen prices have compressed to approximately $4.40 to $4.80 per kg, with structured large-scale procurements approaching $3.00 per kg. Advanced economic modeling indicates that achieving sub-$2.00 per kg by 2030 is technically feasible through appropriate policy measures — a threshold that would revolutionize industrial energy economics and cement India's competitive advantage in sustainable global manufacturing.
The Risks We Cannot Ignore: What Could Derail the Ascent
Intellectual honesty demands that we address the downside risks with the same rigor we have applied to the upside case. There are four our analysis flags as requiring serious attention.
Energy vulnerability is the most immediate concern. India remains a large net energy importer. The IMF's baseline assumes Brent crude normalizes around $82 per barrel. A serious escalation in the Middle East conflict — one that disrupts Strait of Hormuz shipping lanes — could send prices toward $96 per barrel and beyond. At those levels, India's fuel subsidy bill would surge, its current account deficit would widen significantly, and inflationary pressure would force the RBI into a growth-constraining policy stance.
The green hydrogen execution gap represents a medium-term structural risk with direct implications for India's semiconductor and advanced manufacturing ambitions. If the commissioning delay widens further, it threatens to create an industrial energy bottleneck that delays the manufacturing scale-up the economy requires.
Global tech sector re-evaluation hits India disproportionately. Much of the current GCC expansion is predicated on sustained high global technology spending. The IMF explicitly warns that a sudden market reassessment of AI's near-term productivity delivery could trigger a significant pullback in tech investment. For an economy hosting 250,000 AI specialists and $98.4 billion in GCC revenue, this represents a non-trivial concentration risk.
Geoeconomic fragmentation cuts both ways. The same geopolitical dynamics that delivered India its tariff windfall — a US reduction from 50% to 10% on Indian goods — could be partially reversed by shifts in US domestic politics or broader protectionist escalations under Section 122 tariffs. The bilateral trade relationship that currently serves as a growth engine must be actively maintained through sustained diplomatic engagement.
Why Global Capital Is Already Repositioning Toward India
There is a concept in information economics called the E-E-A-T framework — Experience, Expertise, Authoritativeness, and Trustworthiness — originally developed to describe how digital algorithms evaluate content quality. When we apply this framework to sovereign nations as investment destinations, the parallel is remarkably precise.
Just as algorithms penalize opacity and manipulative signaling in favor of verifiable, expert-backed information, global capital markets ruthlessly penalize nations with opaque financial reporting, unpredictable regulatory frameworks, and volatile currencies. India's extraordinary economic narrative is amplified by its unprecedented structural transparency.
The digitized formalization driven by DPI — the UPI transaction ledger, the Account Aggregator framework, the PFMS fund-tracking system — acts as an irrefutable, real-time, open-source record of the nation's economic activity. When the IMF projects India's growth, those projections are anchored by billions of digitally verifiable data points generated daily. This structural transparency directly enhances India's authoritativeness and trustworthiness in the eyes of global rating agencies, institutional investors, and sovereign wealth funds.
The RBI's exchange rate maturation functions, in this framework, as the sovereign equivalent of a highly authoritative institutional signal — verifiable evidence of macroeconomic confidence that builds long-term credibility and attracts the kind of stable, long-horizon foreign direct investment that creates lasting economic capacity.
As global capital allocation increasingly relies on AI-driven data synthesis to assess market viability, India's meticulously structured digital economy ensures it remains at the top of the global investment discovery index.
The Bottom Line: An Economic Earthquake in Slow Motion
When we step back from the granular data and look at the full picture that the IMF's April 2026 World Economic Outlook presents, we are not looking at a trend. We are looking at a transformation — a fundamental, structural realignment of global economic power occurring in real time, moving slowly enough that many observers have not registered its full magnitude.
China is decelerating. Europe is stagnating. The United States is resilient but receding in relative global share. And in this landscape, a nation of 1.4 billion people with a median age under 30 — equipped with a digital infrastructure processing trillions in monthly payments, a GCC ecosystem employing 250,000 AI specialists, a semiconductor fabrication mission backed by $17 billion in approved investment, and an exchange rate regime that now signals genuine institutional maturity — is powering nearly one-fifth of the world's entire economic expansion.
India's 17.0% contribution to global real GDP growth is not a cyclical anomaly driven by a commodity boom. It is not a statistical artifact or a favorable base-effect calculation. It is the measurable, verifiable output of two decades of compounding structural reform, digital infrastructure investment, and human capital development — all arriving at their moment of maximum, simultaneous impact.
For global policymakers, sovereign wealth funds, and corporate strategists, the mathematical reality demands a clear-eyed response: global capital allocation models must urgently recalibrate to reflect the fact that nearly half of all new economic value created on Earth is currently being generated by two Asian nations, with India offering the most compelling combination of demographic scale, domestic demand, and institutional transparency available anywhere in the developing world.
The question for every institution managing global capital is no longer "Should India be a significant part of our portfolio?" The question is now a far more urgent one: "Can we afford for it not to be?"
The balance of power is changing. And the IMF's numbers make it undeniable.
Data Sources: IMF World Economic Outlook, April 2026; IMF Article IV Consultation with the United States, 2026; Reserve Bank of India; Ministry of Electronics and Information Technology, Government of India; IMF DataMapper 2026 projections.
────────────────────────────────────────────────────
DISCLAIMER & TERMS OF USE
Editorial Content & Intellectual Property
All editorial content, written analysis, data interpretations, forward-looking projections, opinion commentary, and research frameworks published in this article are the exclusive intellectual property of WorldPrimePost and are fully protected under applicable international copyright and intellectual property laws. This article — including its analytical models, sectoral breakdowns, the 15-year India–China growth crossover projection, and all original written work — has been independently produced by the WorldPrimePost Capital & Markets Desk. Unauthorized reproduction, republication, scraping, resale, or commercial redistribution of any written content from this article, in whole or in part, without the express prior written consent of WorldPrimePost, is strictly prohibited and may result in legal action.
Permitted Use — Review, Knowledge & Analysis
This content is made available for personal review, academic reference, journalistic citation, policy research, and non-commercial analytical purposes. Researchers, students, analysts, and policymakers may reference, cite, or quote portions of this article for educational, informational, or analytical use, provided that WorldPrimePost is clearly credited as the source with a direct link to the original publication. Any such use must be non-commercial, must not misrepresent the original analysis, and must not be used in a manner that could damage the reputation of WorldPrimePost or its editorial standards.
Data Sources & Third-Party Attribution
Macroeconomic data, statistics, and institutional projections cited in this article are sourced from publicly available reports published by the International Monetary Fund (IMF), the Reserve Bank of India (RBI), the Ministry of Electronics and Information Technology (Government of India), and the IMF DataMapper 2026 projections. WorldPrimePost does not claim ownership over third-party data and acknowledges all respective institutional sources. Forward-looking projections — including India–China growth share crossover timelines — represent WorldPrimePost's independent analytical framework and do not constitute investment advice, financial recommendations, or endorsements of any sovereign, corporate, or financial instrument. Readers are advised to consult qualified financial professionals before making any investment or policy decisions.
Image & Visual Content
All visual assets, images, illustrations, and graphic elements accompanying this article — including the feature image and all in-article visuals — are original creations produced by the WorldPrimePost Illustration & Creative Team using artificial intelligence-assisted generation tools. These visuals are the exclusive intellectual property of WorldPrimePost and are fully protected under applicable copyright law. All images are used solely for editorial illustration and representational purposes. They do not depict verified real-world events, real persons, or actual locations unless explicitly stated. Unauthorized reproduction, redistribution, or commercial use of any visual content from this article without the prior written consent of WorldPrimePost is strictly prohibited.
Limitation of Liability
WorldPrimePost, its editors, analysts, and contributors make no representations or warranties — express or implied — regarding the completeness, accuracy, or timeliness of the information contained in this article. The analysis presented herein is provided on an "as-is" basis for informational and knowledge-sharing purposes only. WorldPrimePost shall not be held liable for any loss, damage, or consequence arising directly or indirectly from reliance on the content of this article.
© 2026 WorldPrimePost. All Rights Reserved. Reproduction in whole or in part without written permission is prohibited.
────────────────────────────────────────────────────
Unlock the full Institutional Analysis
This is a premium deep-dive report. Join an elite community of investors, CEOs, and analysts who receive our exclusive global intelligence for free.
No spam. Unsubscribe anytime.
Related Topics:
"Curating the elite intersection of global culture, cinematic intelligence, high-end gastronomy, and the premium evolution of modern lifestyle."
" Tracking the massive architecture of global capital, sovereign wealth shifts, and the economic engines of the new world order."
"Curating the elite intersection of global culture, cinematic intelligence, high-end gastronomy, and the premium evolution of modern lifestyle."
"Decoding the high-stakes chess game of global statecraft, strategic diplomacy, and the shifting balance of world power."
" Tracking the massive architecture of global capital, sovereign wealth shifts, and the economic engines of the new world order."

WPP Capital & Markets Desk
Tracking the massive architecture of global capital, sovereign wealth shifts, and the economic engines of the new world order.
Get the Weekend Intelligence Briefing
Sign up for the deepest geopolitical and tech insights sent directly to your inbox every Sunday.
No spam. Unsubscribe anytime. View our Privacy Policy.
Loading Next Story